Javascript Performance API in 10 minutes

The Performance API is a set of standards used to measure the performance of web applications. Based on the data that this API provides us, we can then make better decisions on how to improve the overall performance of our application. There are various kinds of metrics that you can focus on to improve performance. For instance, the resources that an application needs to download can be a metric. You can analyze which resource is taking a longer time to download and based on that make a calculated decision to either get rid of it or somehow make it more efficient. Another example could be the largest contentful paint(LCP) score of your app. In simple terms, this is the time taken to render the largest image/text block inside the viewport. Once you know which element takes the most amount of time to render, you can figure out how to reduce this time by making certain adjustments. Just like these metrics, there are several others that we’ll take a look at throughout this blog post.
There’s a video version of this post available on Youtube.
Performance entry
For the metrics that we just discussed, there’ll be a corresponding Performance entry. It’s just an object that’ll hold information related to that metric. The properties change depending on the type of metric but each entry will have a name, duration, startTime, and a type. These 4 properties will be common across all the entries.
Now, for the most part, you don’t really have to do anything to get these entries. They are recorded in the browser and you can directly access them via the performance object that’s present on the global object. This performance object will have a getEntries method that’ll give you information related to all the performance events that have taken place inside your application but it’s not responsible for notifying you about any new events. Also, anytime you call this method, it’s going to give you all the events from the very beginning. So you’ll have to manually filter out the duplicate events as each getEntries call will return all of them. To receive notifications about the entries as they become available and to avoid the duplicate events problem, we’ll use the Performance observer.
Performance observer
The performance observer will look for any specific performance events and whenever an event gets triggered, you can access information related to that event inside a callback function. So let’s create a simple implementation.
    const cb = (list) => {
        list.getEntries().forEach(entry => {
            console.log(entry);
        });
    }

    const observer = new PerformanceObserver(cb)
    observer.observe({ entryTypes: [
          "element",
          "event",
          "first-input",
          "largest-contentful-paint",
          "layout-shift",
          "longtask",
          "mark",
          "measure",
          "navigation",
          "paint",
          "resource"
        ]
    })
We use the PerformanceObserver class to instantiate an observer and inside it, we pass in a callback function. This callback function has access to a list object which has 3 methods, getEntries, getEntriesByName, and getEntriesByType. You can get all the entries or you can filter the entries based on their name/type. When listening for events in the application, we’ll have to explicitly mention the entry type that we want to observe. So inside the observe method, we pass an options object which has an entryTypes property. This is going to be an array with whatever entry types we would like to observe. You can check what all events are present in your browser that you can observe by typing in PerformanceObserver.supportedEntryTypes inside the browser console.
You can also pass in a single entry using the type option instead of the entryTypes array. There’s another boolean option that’s available called buffered. This buffered flag enables the observer to access entries from before the observer’s creation. This way, we do not miss any information on the performance events between the start of the page load and the observer creation. Now this buffer size also has a limit. So there might be a chance wherein the buffer is full and there are some additional events yet to be added to it. There’s not much that you can do about this but the API at least provides us with a way to get the number of dropped entries due to the buffer being full. You can achieve this by passing in a parameter inside the callback function.
    //The second argument will be the observer instance and
    //you can get the dropped entries count from the third argument.
    const cb = (list, observer, droppedEntriesCount) => { ...
Now that we have a basic idea of the performance entry and how to use the Performance observer to track these entries, let’s see what all kinds of entries are available and how we can use them to improve performance.
ElementTiming
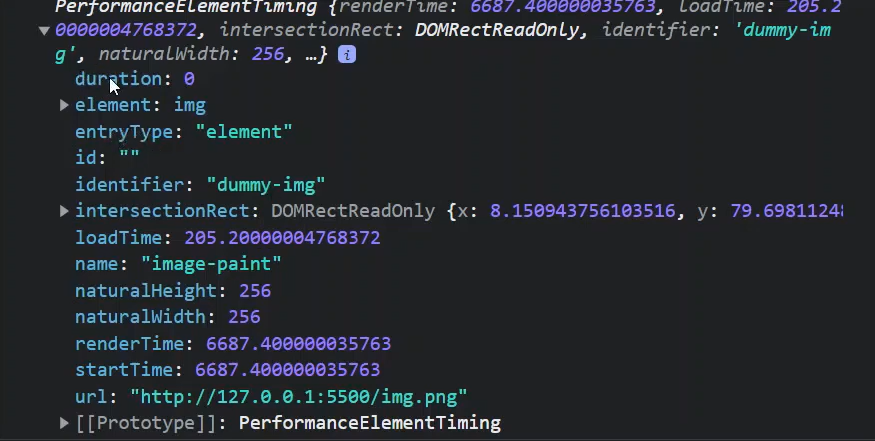
This entry contains information related to the render timing for image and text nodes. We mark the nodes that we want to track using the elementtiming attribute.
    <p elementtiming="dummy-text">Hello world</p>
    <img src="./img.png" alt="" elementtiming="dummy-img">
Inside the HTML body, add these 2 tags. Also, make sure to have the Performance observer script, from the earlier example, inside this file. (You should comment out every other entry except “element” inside the entryTypes array so that you only see one type of entry inside the browser console.)
Inside the browser, you’ll find 2 events for the paragraph and the image. We have the common properties from the main PerformanceEntry interface, the start time, type, name, and duration along with some properties specific to this entry. Based on the size of the node that you get from the intersectionRect property or the time it took to render on the page, you can then analyze to see if there’s anything that you can do to this node so as to improve performance.
You also get a toJSON method on all these entries to convert them into JSON objects. This can be used to generate reports by passing in the JSON object to certain analytics endpoints.
FirstInput & EventTiming
The second and the third entry types, event, and first-input, are somewhat similar. They’re both instances of the PerformanceEventTiming interface and they both deal with latency triggered by certain user interactions. You’ll get the event entry type anytime there’s a delay in handling an event. For instance, say I have a button and this button has a click event handler. Now if there’s a blocking task inside this event handler, then it’s going to take a while to resolve it which ultimately creates a delay.
The first input entry is kinda similar to the event entry. It deals with FIDs or first input delays which basically is the time from the point when a user first interacts with your app to the point when the browser is actually able to respond to that interaction.
So to see this in action, I’ll create a button and attach a click event listener to it. Inside this, I’ll run a for loop, and at the end of the for loop, I’ll simply log the number of hits.
//HTML
<button id="clickBtn">Click me</button>
//JavaScript
const clickBtn = document.getElementById("clickBtn")
const handler = () => {
for (let i = 0; i < 10000; i++) {
if (i == 9999) console.log(i + 1 + " hits!!!");
}
}
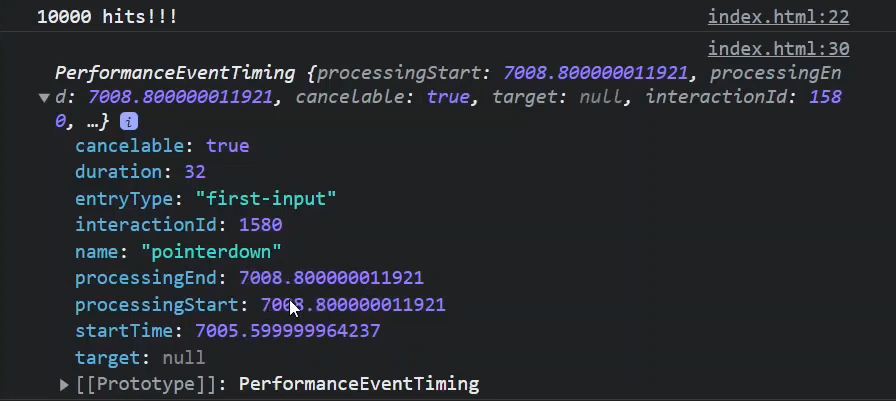
clickBtn.addEventListener('click', handler)Now inside the browser, when you click on the button, you’ll get a first-input entry. The startTime is when you click on the button. After a few extra milliseconds, it starts the processing of the event handler. Resolving the event handler essentially takes no time.
To get an event entry, we need to create a significant delay in our click event. Try adding a few extra zeros inside your for loop and see what happens. Inside the browser, you’ll find a bunch of event entries for different types of events. When you click on the button, there are a few extra events that get triggered along with the click event. If you open the click event entry
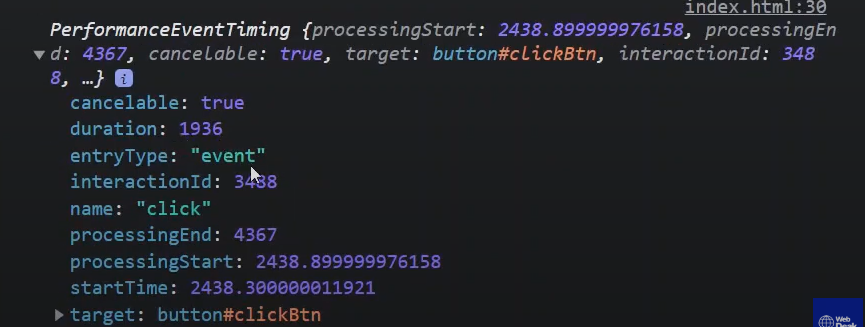
you can see that it started off at 2.4s and ended at about 4.3s. The delay as you can see in the duration property is about 1.9s. Only when the duration is more than 100ms will the event be considered a delay-inducing event. Anything less is not considered to cause delay and will not be picked up by the performance observer. Based on this information that you have now, you can then make a decision to maybe move the calculation to a later part or maybe run it asynchronously without blocking user interaction with the application.
Largest contentful paint(LCP)
This entry will give timing information regarding the largest image or text painted on the screen before any user input.
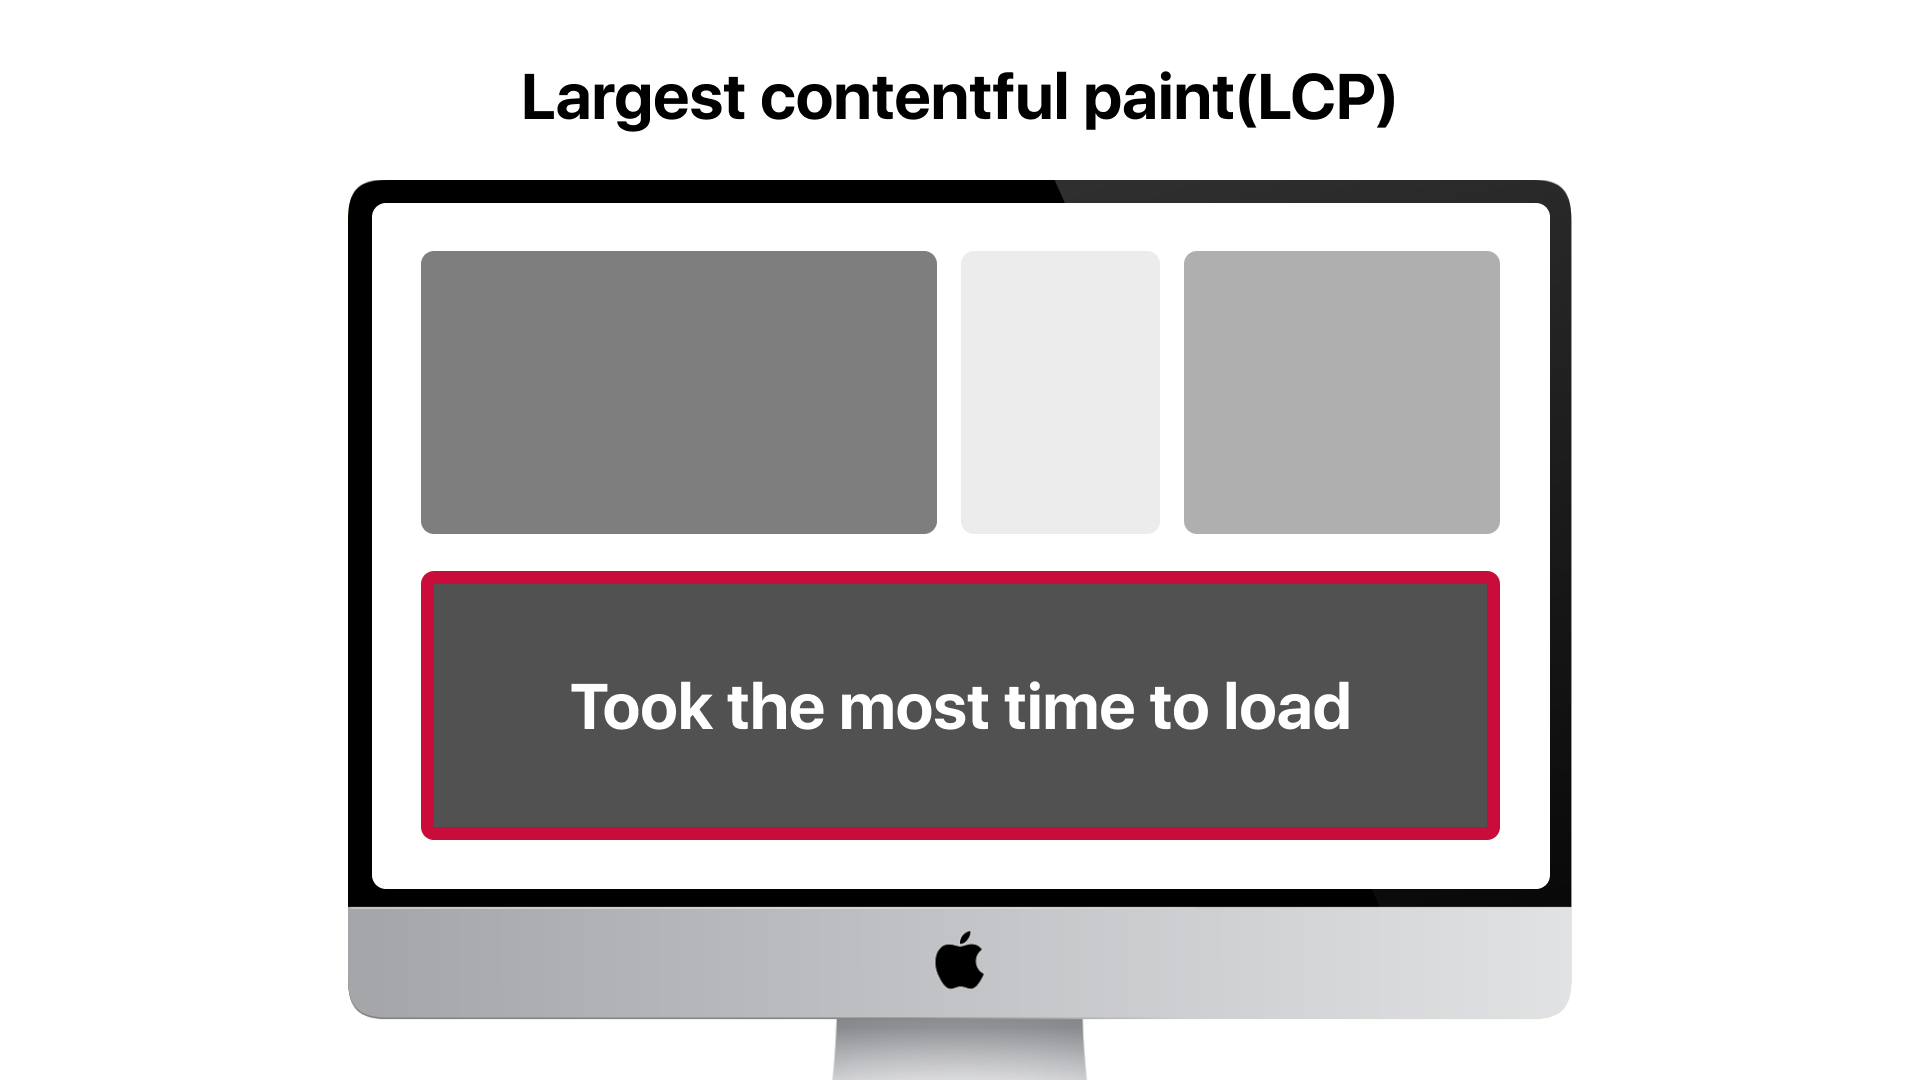
If you have the largest-contentful-paint value uncommented inside your entryTypes list, you must’ve already seen an LCP entry in your browser console.
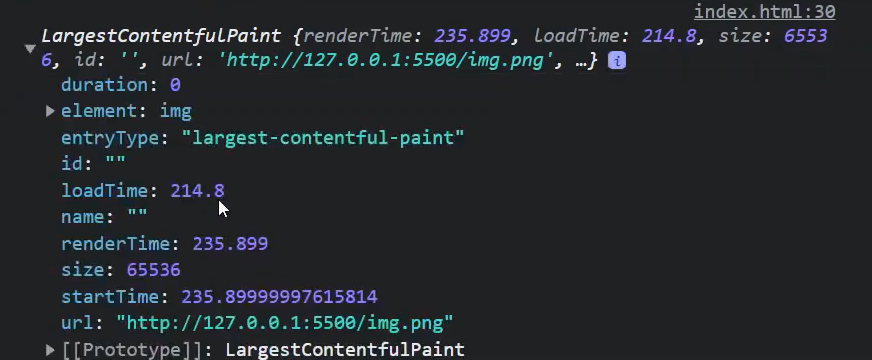
You can find the load time and the render time for a resource along with its size(width * height). So if you have a high LCP score, you can think of maybe lazy loading the resource if it’s not essential to the initial page load, to improve performance.
Layout shift
When your website is downloading all of its resources, at times some resources might take a while to download. For example, let’s say there is a high-resolution image on your webpage. The rest of the content on your page has been loaded, but this image took and while and once it got downloaded, it rendered on the page where it was supposed to but because of that the rest of the elements have now shifted.
To see this in action, I have a paragraph, an image container, and an image on my HTML page. The image container will get the image after a while. When that happens, it’s going to forcefully shift the image below it. This shift is called a layout shift and it’s definitely not a good experience.
    //HTML
    <p id="clickBtn">Click me</p>
    <div class="img-container"></div>
    <img src="./img.png" alt="">

    //Javascript
    const insertImage = () => {
        let img = document.createElement('img')
        img.setAttribute("src", "https://i.pinimg.com/originals/fa/0c/05/fa0c05778206cb2b2dddf89267b7a31c.jpg")
        document.querySelector(".img-container").append(img)
    }

    setTimeout(() => insertImage(), 5000)
The layout shift entry that gets created when the image loads, will look something like this.
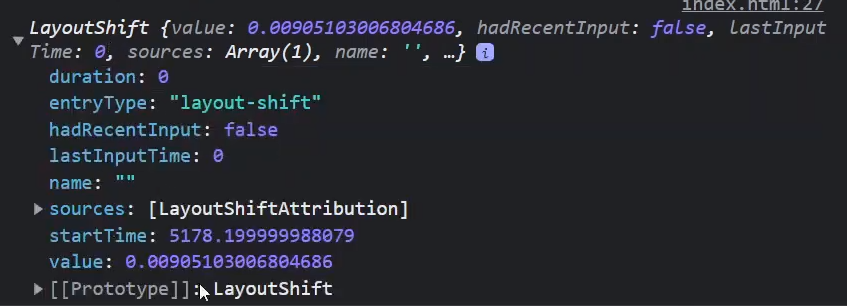
Most of the properties are similar to the previous entries. The value prop gives you the fraction of the viewport that was shifted. So higher the value, the more drastic would be the layout shift. Inside the sources property, you’ll find the element that shifted in your application, its previous position, and current position information. Since this is an array, it can have multiple elements based on how they’re placed in your web app.
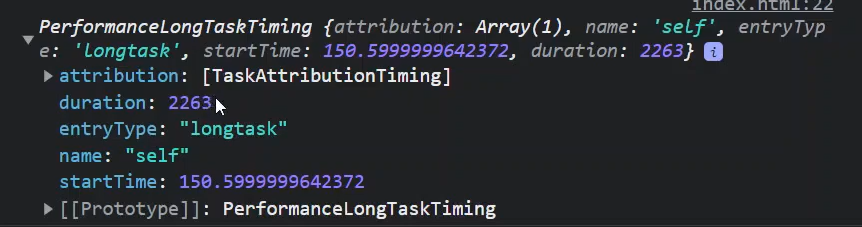
Long task
This one’s is a no-brainer. It’s the long task entry and as the name suggests, this will cause the observer to push an entry when there’s a long task. So any task that blocks the main thread for more than 50 milliseconds is considered as a long task. You can see this in action by using the same for loop from the event entry example.
Since the calculation is on the main thread, any other task like user interaction will be blocked. So this is definitely something one should avoid.
Mark and Measure
Up until now, the performance tracking events used to get automatically fired and we simply accessed them. Mark and measure will be manually triggered by us in the application. So, the browser has this performance timeline where all these performance entries get logged which we then access to analyze performance bottlenecks. Events up until now, were automatically picked up by the browser when something particular happened and then pushed to the timeline. But what if you want to measure some parts of your application manually?
For example, when a user clicks a button or performs a specific task within your application, you want to accurately measure how long it took to run that particular task. So this is where mark and measure come in. These 2 methods are part of the User Timing API. The User Timing API is an extension to the browser’s performance timeline and helps you to measure and record performance data that is custom to your application.
Mark is available on the performance object which is part of the window object. It lets you mark a certain action. So, for the same for loop let’s use these 2 methods to measure its duration.
    performance.mark('loop-started')

    for (let i = 0; i < 1000000000; i++) {
        if (i == 999999999) console.log(i + 1 + " hits!!!");
    }

    performance.mark('loop-ended')

    console.log("Loop time", performance.measure('loop-duration', 'loop-started', 'loop-ended'))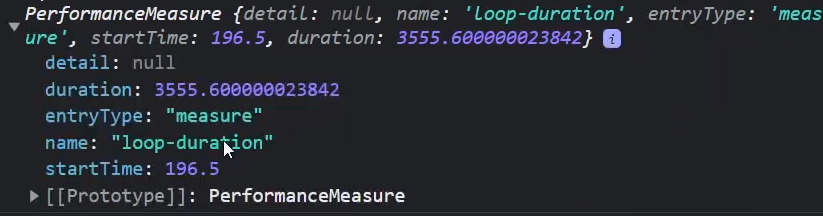
Using these methods, you can now manually check if there are any parts in our application that take some extra time to execute.
Navigation and Resource
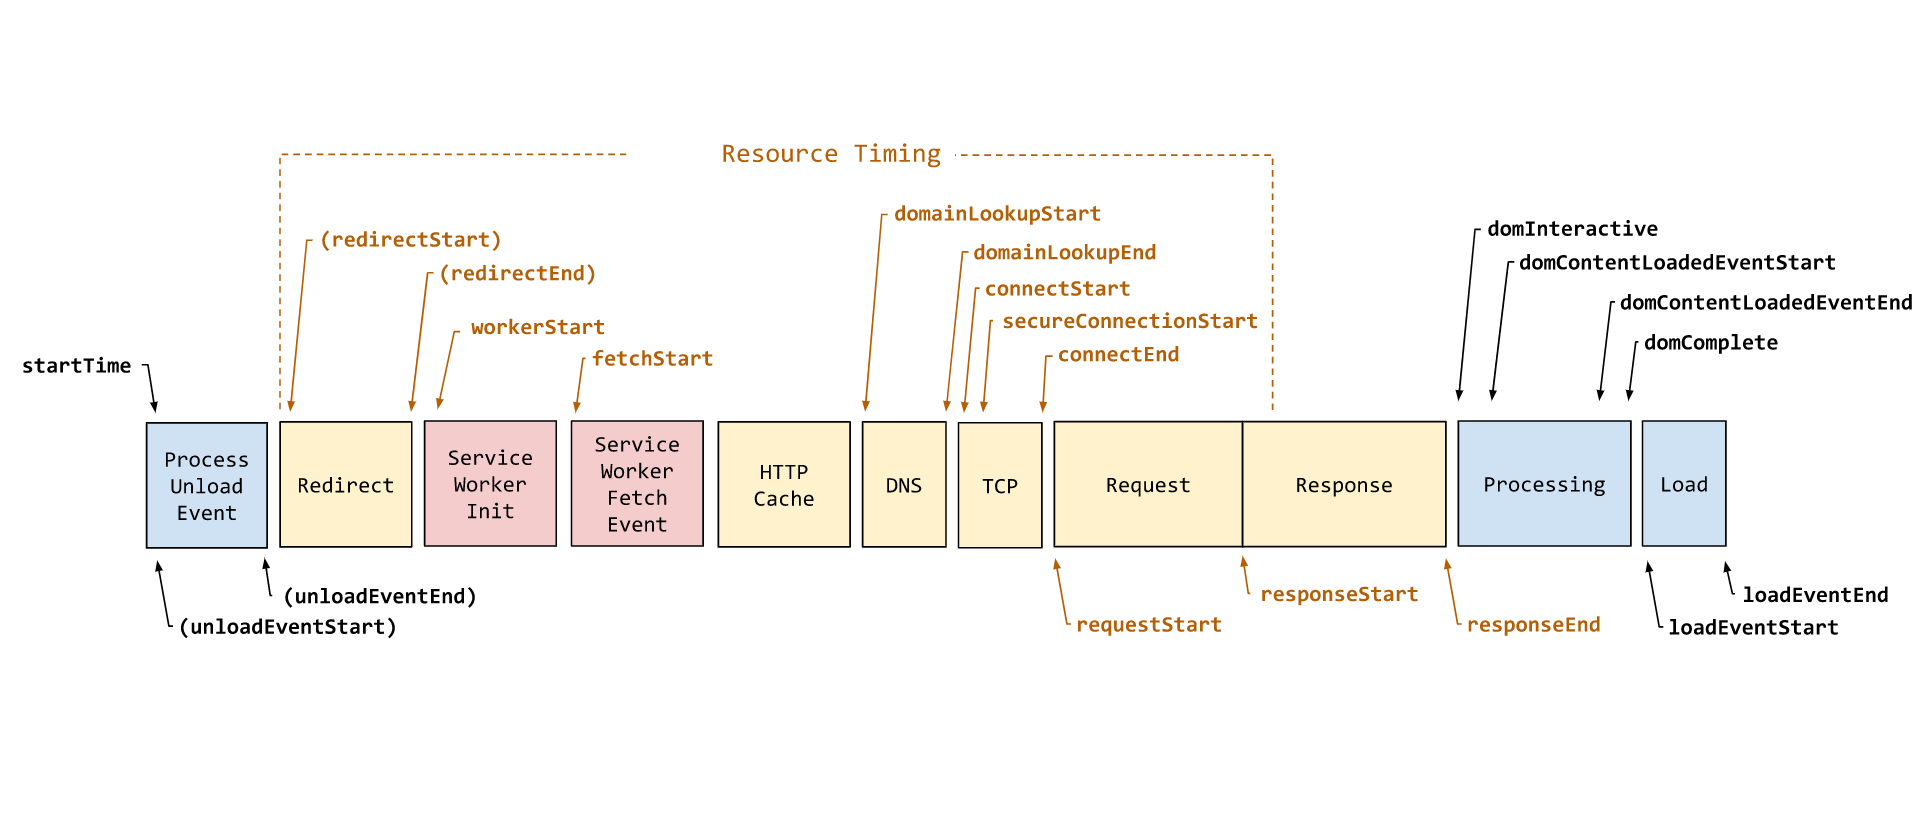
The Navigation entry deals with the browser’s document navigation events. Whenever a document loads in your browser, there are a series of events that take place in the background. All the information related to these events can be accessed and used to measure any issues or bottlenecks in performance. This chart here from MDN will give you a decent idea of what all sub-events take place when a document gets loaded.
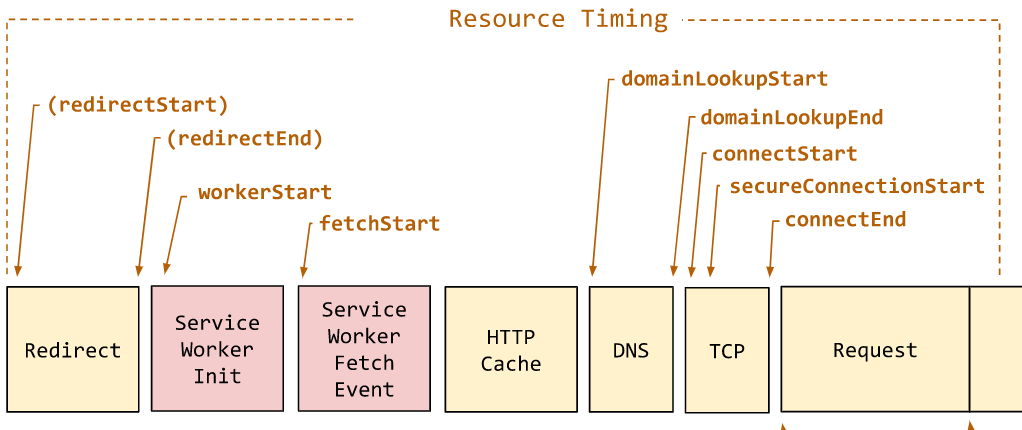
The PerformanceResourceTiming interface enables retrieval and analysis of detailed network timing data regarding the loading of an application’s resources. An application can use the timing metrics to determine, for example, the length of time it takes to fetch a specific resource, such as an XMLHttpRequest, SVG, image, or script. It’s like a subset of the navigation entry which is why you’ll also find a lot of the same properties inside this entry.
Paint
Finally, we have the Paint entry that’ll give you information about paint or render operations during web page construction. When working with paint operations we focus mostly on FCP and LCP.
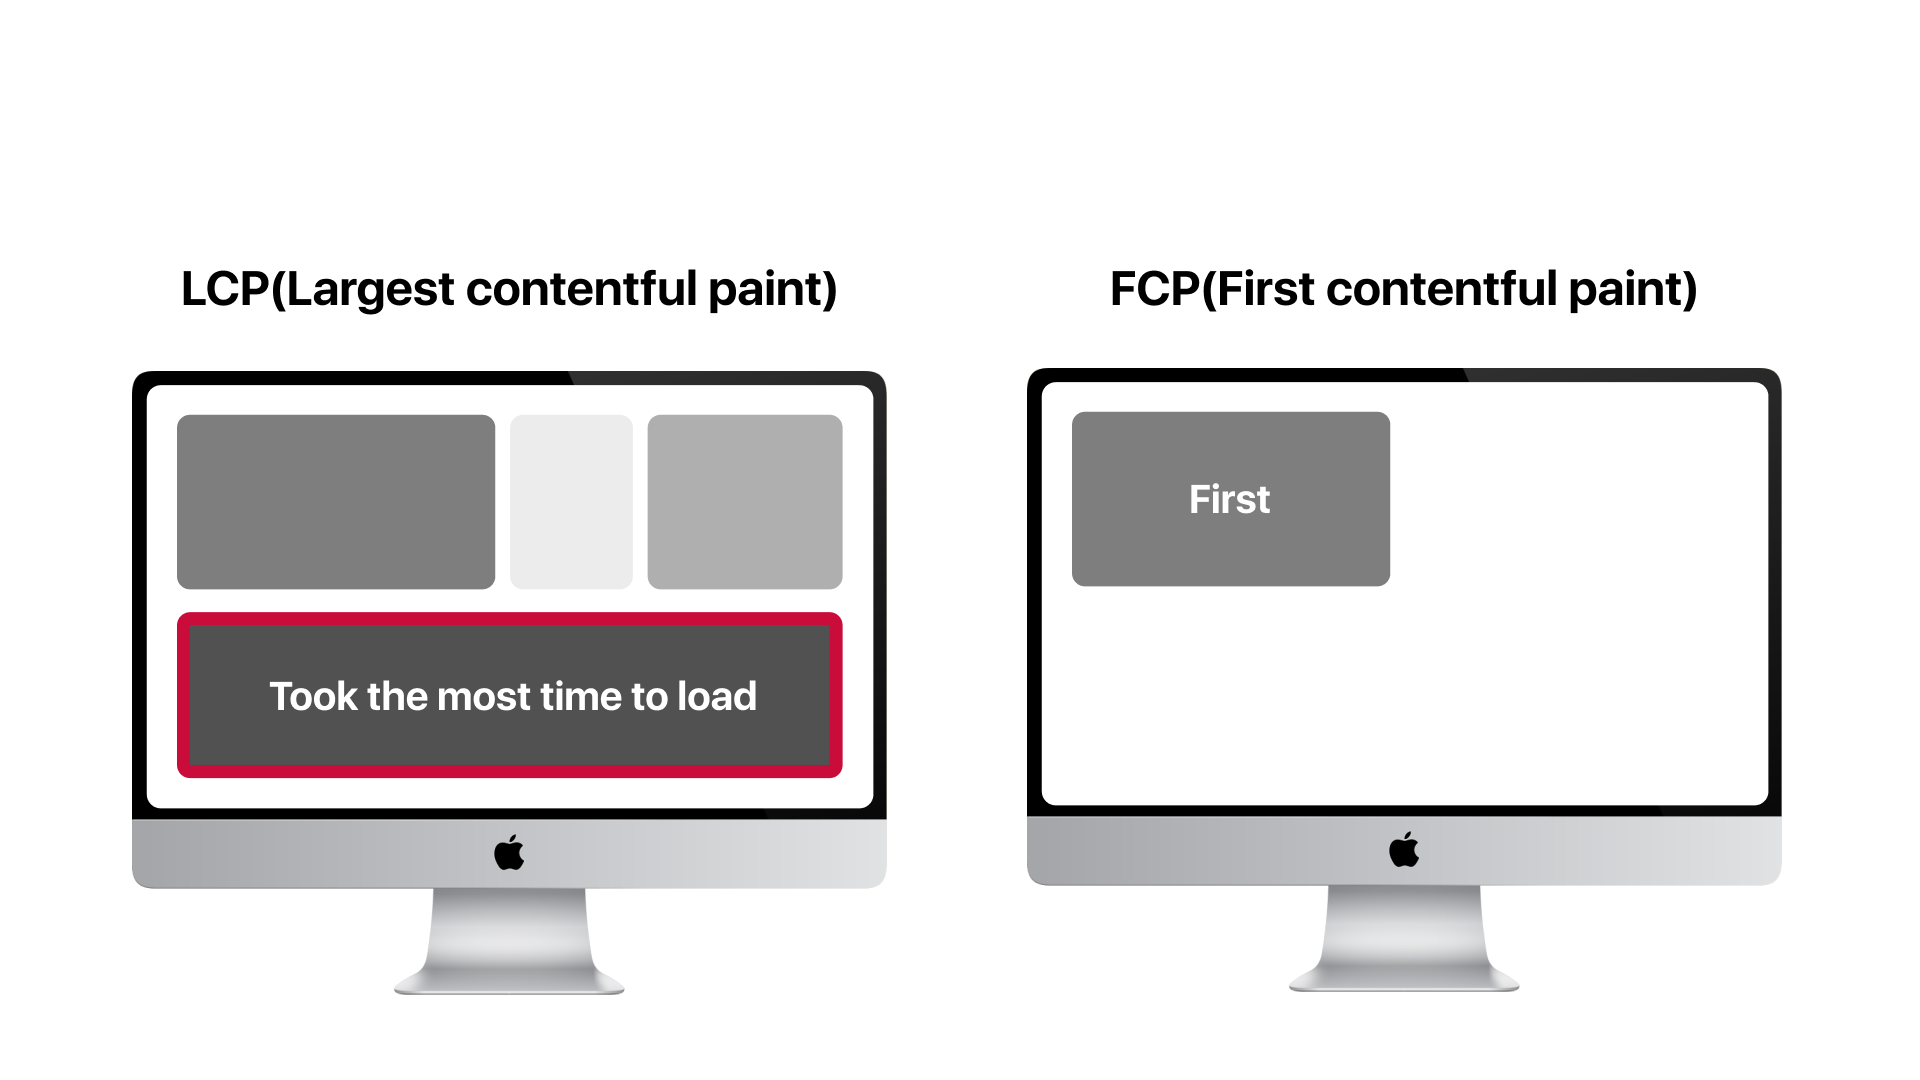
We’ve already looked at LCP which was the largest contentful paint, so the largest dom node that got rendered before any user input. FCP is the first DOM text or image content that gets rendered. The data this API provides helps you minimize the time that users have to wait before they can see the site’s content start to appear. Decreasing the time until these key paint moments make sites feel more responsive, performant, and engaging for your users.
Conclusion
And with that, we’ve looked at all the key performance events that are tracked by your browser during an application’s lifecycle. Knowing how to use the Performance Observer is not the difficult part. Looking at the data and taking decisions on what to add, change or get rid of is the real task. This was a very brief overview of how you can track different kinds of events and later on do some analysis to improve the overall performance of the application based on the data collected from the API. So try to play around with this tool and see if you can improve any aspect of your application.